LOOK — Unlock Consumer Behavior with Live, Ethical AI
Turn physical interactions into measurable signals. Book a demo to see heatmaps, watch-time metrics, and conversion attribution in action.
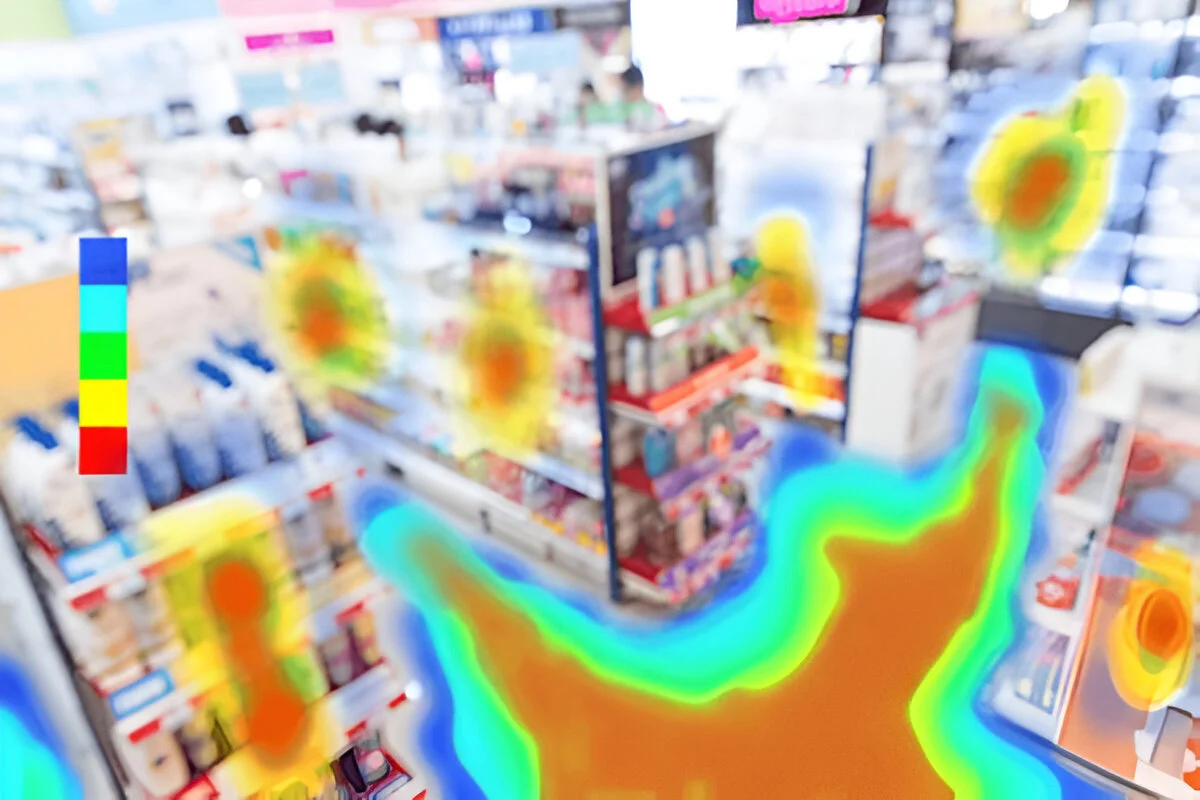
Store Experience Optimization
Heatmaps show which aisles attract attention and which displays are blind spots. Optimize product placement and staff allocation.

Pop-up & Event Analytics
Real-time dashboards reveal which activations drive dwell and social sharing; optimize placement and timing mid-event.

OOH Creative Validation
Integrate with Boldstreet OOH to verify which creatives attracted attention and generated store visits — creating a closed-loop OOH → in-store attribution.
Category & Merch Testing
Run A/B product placement tests across branches and measure uplift in pick-up vs. pass-by rates.

Loss Prevention & Operational Alerts
Identify suspicious behavior patterns (loitering, repeated shelf probing) and alert staff before loss escalates.
Edge-first Computer Vision
- Custom-tuned for object & pose detection, head-pose, and gaze approximation, trained on regional contexts.
- On-edge anonymization: faces blurred by default; identifying images discarded unless lawfully required.
Sensor Fusion
- Inputs: RGB cameras, passive infrared counters, Bluetooth/Wi-Fi beacons (optional), POS/time-stamp events.
- Fusion logic matches anonymous tokens and visual metadata for reliable visit paths while preserving privacy.
Streaming & Analytics
- Kafka streams for anonymized event aggregation, cohorting, and ML scoring (dwell propensity, repeat-visitor likelihood).
- Real-time rules engine for alerts and creative swaps on Boldstreet OOH screens.
Attribution & Linkage
- Links impressions to POS, CRM, or location pings via secure APIs for near-real-time conversion measurement.
Security & Compliance
- TLS + AES-256 encryption, role-based access, configurable retention, GDPR-style controls for Kenyan regulations.
Attention & Engagement
- Glance Rate: % of passersby who look at the display or shelf.
- Average Dwell Time: seconds per viewer.
- Watch-to-Conversion Rate: % of watchers who purchase (via POS).
- Repeat Exposure Rate: % of unique visitors returning within a time window.
Movement & Pathing
- Heatmaps: time-sliced density visualizations (people/m²).
- Origin → Destination Paths: visitor navigation patterns.
- Queue Length & Wait-Time Profiles at checkouts.
Demographics & Segmentation
- Age-range buckets, broad gender indicators, group vs. individual shoppers (aggregate, no PII).
Creative & Campaign Metrics
- Creative View Rate: % of viewers registering attention for a creative.
- A/B Variant Performance: watch time uplift and conversion attributions.
Operational Metrics
- Staff Efficiency Index: predicted vs. actual staffing needs.
- Shrinkage Risk Score: composite metric for anomalous behavior.
Assessment & KPI Workshop
1 week
Define business goals, POS/CRM hookups, legal signage, and pilot metrics.
Pilot Deployment
3–6 weeks
Edge device + 2–6 camera zones, dashboard access, baseline benchmarking, one POS/CRM integration.
Optimization & Scale
4–12 weeks
Expand to additional branches, train models on site-specific data, add cohort analysis and automated recommendations.
Ongoing Operations
Ongoing
Monthly model tuning, quarterly business reviews, add-on modules (e.g., emotion scoring, loyalty integration).
Insight Pilot
3 sites, 4-week baseline, heatmaps, attention & dwell dashboards, one POS integration.
Growth Insights
Up to 12 sites, A/B testing module, conversion attribution, weekly analytics reviews.
Enterprise Insights
Region-wide rollout, custom integrations (ERP/CRM), SLA, dedicated success manager.
Objective
A nationwide retailer launched a 10-day pop-up but lacked fast feedback on creative and merchandising.
Approach
Deployed LOOK at 5 pop-up sites, instrumented 3 camera zones per site and connected POS. Ran two creative variants and A/B shelf placements.
Outcome
Variant B increased average dwell 36% and produced a 22% lift in same-day purchases attributable to the pop-up. The retailer rolled the winning layout to 12 branches within 30 days, improving conversion rates chain-wide.